Category Archives: #graphic organizer

Teaching Mixture Problems With The Mixture Picture

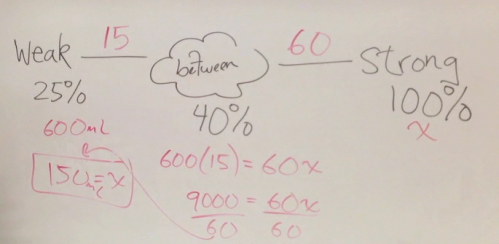
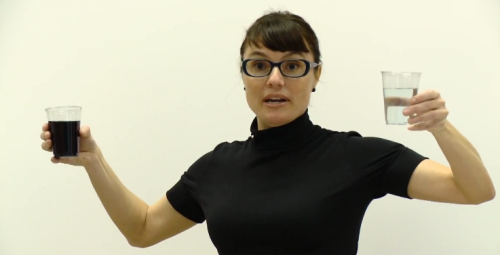
I just want to throw my hat into the mix and say that I also have found Marlo Warburton’s “Mixture Picture” to be an extremely effective way of teaching mixture problems.  I mean you get to do a demonstration in an algebra class!  Just that alone makes it awesome, not to mention students like it and find it helpful.  So what is it? (You haven’t seen the video?  You are soo uncool)  The “Mixture Picture” is a graphical organizer that helps students make sense of mixture problems.  The above link directs you to the Teaching Channel that has a video of her giving the lesson, as well as handouts.

Screen shot 2013-05-12 at 5.14.43 PM

I have never had much success with mixture problems, so I was happy to try anything different.  I could not have been happier with the results – the entire class was engaged.  After the first example, a majority of the class was up and running on it.  I am not going into the details of it because it is all in the video, which I followed very closely.  I’ll just move into some advice I have gained from the experience.

MixturePictureWhiteBoard

The Advice

1.  If you are going to use the worksheets from the Teaching Channel, then I would start with the worksheet “Homework Sheet for Day 1 of Mixture Problems” because problem #2 of the worksheet “8th Grade Mixture Problems” is too different from problem #1.

2.  Don’t give your students anything in Comic Sans – so retype the worksheet “Homework Sheet for Day 1 of Mixture Problems” with a different font.

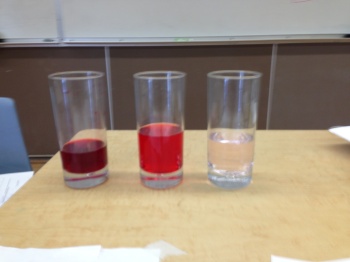
3.  Do the demonstration.  I brought in some red food coloring and continued to go back to that demonstration throughout the class.  Check the video for how to do the demonstration.

MixturePictureDemo

4.  My students quickly grasped how to do it when there were three percentages given – but when only two percentages are given, the students initially struggle.  That’s why I brough the container of food coloring to class with me.  Because food coloring is a 100% food coloring!  That helped them know when to use 100%.

5.  The Seesaw example that Marlo does on the whiteboard is critical to show the students.   I would continue to go back to it every time the students were working on a mixture problem.

The Goods

All the handouts are on the Teaching Channel website.  But remember the Mixture Picture is a method – not a worksheet, so you can just use the mixture problems in your textbook.

Who Am I – Quadratics

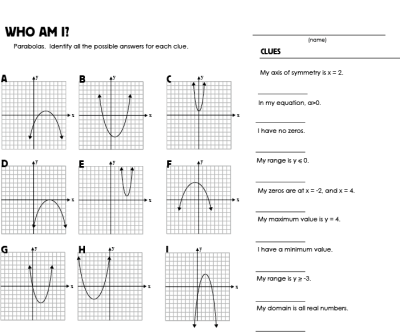
Here’s another ‘Who Am I’ style worksheet.  I posted a few others a while back, which you can find here.  Some of the clues are intentionally general, and thus will have multiple answers.  The students must list all possible answers.  I used this worksheet the day after playing Quadratic Taboo.

WhoAmI_Quadratics

The Goods

WhoAmI_Quadratics

‘Who Am I’ Worksheets

The Overview

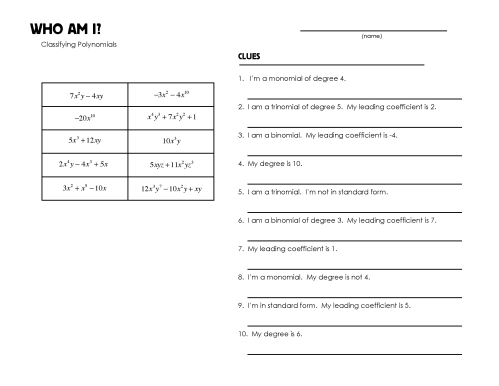
I have been making more of these “Who Am I” style worksheets where the students are given a set of clues and possible answers, and they need to figure out which answer works for which clue.  I would consider this a graphical organizer and a puzzle activity, since all the information is already organized, and the students are making connections between the answers and the clues.

The worksheet for graphing slope intercept has exactly one right answer for each clue.  The one for classifying polynomials has a couple right answers for some of the clues.  I think my next “Who Am I” worksheet will have some answers that do not fit any of the clues, which will take away any process of elimination technique the students may be using.

WhoAmIClassifyingPolynomials

The Goods

WhoAmI_SlopeIntercept

WhoAmI_ClassifyingPolynomials

Macro-Differentiation

These are a listing of hastags that I use to catagorize my lessons plans.  Each catagory represents a different style lesson plan.  My instructional goal is typically to make sure that I use each hashtag at least once a month.  The goal of this blog is to share all the lesson plans that I use under each hashtag.

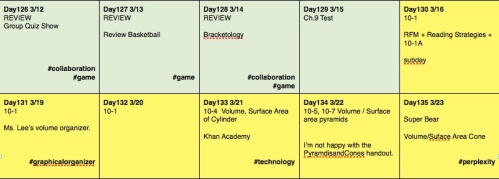
My detailed lesson plans are my Keynote slides.  But along with those, I make a quick, calendar-style overview to me a general idea of what I am doing.  It’s on this calender where I place the hashtags at the bottom of each day.  This allows me  to quickly look back at what I have been doing, and know whether of not I am differentiating.  For example, here is two weeks worth of my lesson plans in geometry.  Notice that I can quickly see whether or not I have differentiated my instruction, without having to analyze each specific lesson plan.  The hashtags allow me to get a quick sense of what I have been doing, and what I have not been doing.


*Notes –

-The term “perplexity” is being used as described by Dan Meyer here